Matplotlib датирует YearLocator с нечетными интервалами
Прямо сейчас у меня есть рабочий бит кода, который форматируется в соответствии с моей спецификацией, когда мои временные ряды начинаются в начале десятилетия (т. е. 1990,2000, 2010 и т. д.), но я не знаю, как адаптировать мой код, чтобы иметь правильное форматирование, когда мой временной ряд начинается в год, который даже не является (т. е. 1993).
import pandas as pd
import matplotlib.pyplot as plt
from matplotlib import dates
def format_xaxis(fig):
years = dates.YearLocator(10,month=1,day=1)
years1=dates.YearLocator(2,month=1,day=1)
dfmt = dates.DateFormatter('%Y')
dfmt1 = dates.DateFormatter('%y')
[i.xaxis.set_major_locator(years) for i in fig.axes]
[i.xaxis.set_minor_locator(years1) for i in fig.axes]
[i.xaxis.set_major_formatter(dfmt) for i in fig.axes]
[i.xaxis.set_minor_formatter(dfmt1) for i in fig.axes]
[i.get_xaxis().set_tick_params(which='major', pad=15) for i in fig.axes]
for t in fig.axes:
for tick in t.xaxis.get_major_ticks():
tick.label1.set_horizontalalignment('center')
for label in t.get_xmajorticklabels() :
label.set_rotation(0)
label.set_weight('bold')
for label in t.xaxis.get_minorticklabels():
label.set_fontsize('small')
for label in t.xaxis.get_minorticklabels()[::5]:
label.set_visible(False)
df = pd.DataFrame.from_dict({'Y': {0: 0.15, 1: 0.18, 2: 0.23, 3: 0.15, 4: 0.15, 5: 0.15, 6: 0.17, 7: 0.175, 8: 0.212, 9: 0.184, 10: 0.18, 11: 0.18, 12: 0.21, 13: 0.139, 14: 0.15, 15: 0.128, 16: 0.126, 17: 0.1, 18: 0.11, 19: 0.183, 20: 0.14, 21: 0.12, 22: 0.155, 23: 0.245, 24: 0.248, 25: 0.262, 26: 0.17, 27: 0.143, 28: 0.13, 29: 0.102, 30: 0.258, 31: 0.293, 32: 0.196, 33: 0.21, 34: 0.14, 35: 0.17},
'Date': {0: '1990-06-10 00:00:00', 1: '1991-07-26 00:00:00', 2: '1992-10-15 00:00:00', 3: '1993-10-08 00:00:00', 4: '1994-04-07 00:00:00', 5: '1994-11-20 00:00:00', 6: '1995-04-24 00:00:00', 7: '1996-02-13 00:00:00', 8: '1996-04-15 00:00:00', 9: '1996-09-12 00:00:00', 10: '1997-02-13 00:00:00', 11: '1997-04-20 00:00:00', 12: '1997-08-23 00:00:00', 13: '1997-11-06 00:00:00', 14: '1998-04-15 00:00:00', 15: '1999-05-04 00:00:00', 16: '2000-03-17 00:00:00', 17: '2000-06-01 00:00:00', 18: '2001-10-05 00:00:00', 19: '2002-09-20 00:00:00', 20: '2003-04-25 00:00:00', 21: '2003-09-20 00:00:00', 22: '2005-05-07 00:00:00', 23: '2006-10-07 00:00:00', 24: '2007-10-13 00:00:00', 25: '2008-02-02 00:00:00', 26: '2008-03-28 00:00:00', 27: '2008-10-10 00:00:00', 28: '2009-10-10 00:00:00', 29: '2011-10-05 00:00:00', 30: '2012-10-03 00:00:00', 31: '2013-09-21 00:00:00', 32: '2014-09-23 00:00:00', 33: '2015-09-22 00:00:00', 34: '2016-10-01 00:00:00', 35: '2017-09-29 00:00:00'}})
df['Date'] = pd.to_datetime(df['Date'], format='%Y-%m-%d %H:%M:%S')
fig, ax = plt.subplots()
df.plot('Date','Y',ax=ax,marker='x',ls='-')
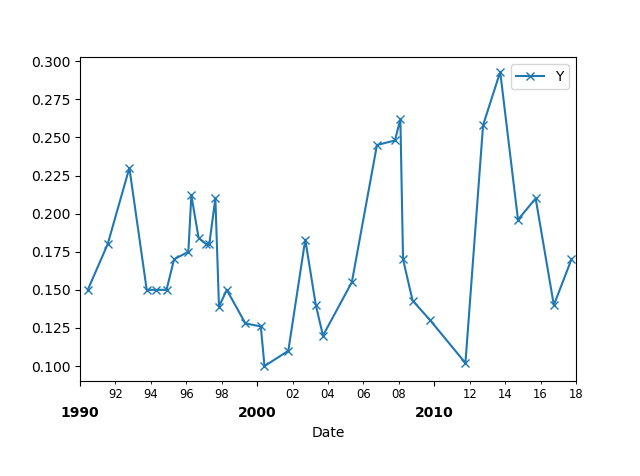
ax.set_xlim(pd.datetime(1990, 1, 1), pd.datetime(2018, 1, 1))
format_xaxis(fig)
Который создает сюжет, который выглядит следующим образом::
Как бы я воссоздал вышеупомянутый сюжет с временным рядом, который начинается в 1993 году? Я все еще хотел бы незначительные метки галочки устанавливается каждые два года (т. е. 95,97,99,01,....). Можно ли использовать matplotlib.даты.YearLocator для форматирования дат, когда график временного ряда начинается в нечетный год?
2 ответов:
Вы можете подкласс
YearLocator, чтобы иметь свой обычайOffsetYearLocator.from matplotlib import dates class OffsetYearLocator(dates.YearLocator): def __init__(self, *args, **kwargs): self.offset = kwargs.pop("offset", 0) dates.YearLocator.__init__(self,*args, **kwargs) def tick_values(self, vmin, vmax): ymin = self.base.le(vmin.year)-self.offset ymax = self.base.ge(vmax.year)+(self.base._base-self.offset) ticks = [vmin.replace(year=ymin, **self.replaced)] while True: dt = ticks[-1] if dt.year >= ymax: return dates.date2num(ticks) year = dt.year + self.base.get_base() ticks.append(dt.replace(year=year, **self.replaced))Это может обрабатывать дополнительный аргумент
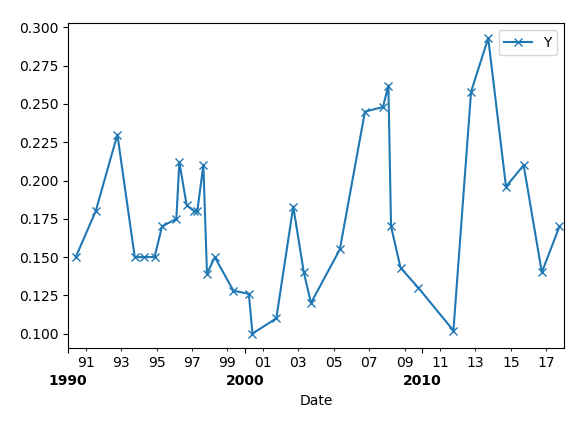
offset, который вычитается из года. В этом случае можно было бы сохранитьbaseКак2(каждые два года), но использовать смещение1.years1 = OffsetYearLocator(2, month=1, day=1, offset=1)Полный пример:
import pandas as pd
import matplotlib.pyplot as plt
from matplotlib import dates

class OffsetYearLocator(dates.YearLocator):
    def __init__(self, *args, **kwargs):
        self.offset = kwargs.pop("offset", 0)
        dates.YearLocator.__init__(self,*args, **kwargs)
    def tick_values(self, vmin, vmax):
        ymin = self.base.le(vmin.year)-self.offset
        ymax = self.base.ge(vmax.year)+(self.base._base-self.offset)
        ticks = [vmin.replace(year=ymin, **self.replaced)]
        while True:
            dt = ticks[-1]
            if dt.year >= ymax:
                return dates.date2num(ticks)
            year = dt.year + self.base.get_base()
            ticks.append(dt.replace(year=year, **self.replaced))

def format_xaxis(ax):

    years = dates.YearLocator(10,month=1,day=1)
    years1=OffsetYearLocator(2,month=1,day=1, offset=1)
    dfmt = dates.DateFormatter('%Y')
    dfmt1 = dates.DateFormatter('%y')

    ax.xaxis.set_major_locator(years)
    ax.xaxis.set_minor_locator(years1)
    ax.xaxis.set_major_formatter(dfmt)
    ax.xaxis.set_minor_formatter(dfmt1)
    ax.get_xaxis().set_tick_params(which='major', pad=15)

    plt.setp(ax.get_xmajorticklabels(), rotation=0, weight="bold", ha="center")


df = pd.DataFrame.from_dict({'Y': {0: 0.15,  1: 0.18,  2: 0.23,  3: 0.15,  4: 0.15,  5: 0.15,  6: 0.17,  7: 0.175,  8: 0.212,  9: 0.184,  10: 0.18,  11: 0.18,  12: 0.21,  13: 0.139,  14: 0.15,  15: 0.128,  16: 0.126,  17: 0.1,  18: 0.11,  19: 0.183,  20: 0.14,  21: 0.12,  22: 0.155,  23: 0.245,  24: 0.248,  25: 0.262,  26: 0.17,  27: 0.143,  28: 0.13,  29: 0.102,  30: 0.258,  31: 0.293,  32: 0.196,  33: 0.21,  34: 0.14,  35: 0.17},
                             'Date': {0: '1990-06-10 00:00:00',  1: '1991-07-26 00:00:00',  2: '1992-10-15 00:00:00',  3: '1993-10-08 00:00:00',  4: '1994-04-07 00:00:00',  5: '1994-11-20 00:00:00',  6: '1995-04-24 00:00:00',  7: '1996-02-13 00:00:00',  8: '1996-04-15 00:00:00',  9: '1996-09-12 00:00:00',  10: '1997-02-13 00:00:00',  11: '1997-04-20 00:00:00',  12: '1997-08-23 00:00:00',  13: '1997-11-06 00:00:00',  14: '1998-04-15 00:00:00',  15: '1999-05-04 00:00:00',  16: '2000-03-17 00:00:00',  17: '2000-06-01 00:00:00',  18: '2001-10-05 00:00:00',  19: '2002-09-20 00:00:00',  20: '2003-04-25 00:00:00',  21: '2003-09-20 00:00:00',  22: '2005-05-07 00:00:00',  23: '2006-10-07 00:00:00',  24: '2007-10-13 00:00:00',  25: '2008-02-02 00:00:00',  26: '2008-03-28 00:00:00',  27: '2008-10-10 00:00:00',  28: '2009-10-10 00:00:00',  29: '2011-10-05 00:00:00',  30: '2012-10-03 00:00:00',  31: '2013-09-21 00:00:00',  32: '2014-09-23 00:00:00',  33: '2015-09-22 00:00:00',  34: '2016-10-01 00:00:00',  35: '2017-09-29 00:00:00'}})

df['Date'] = pd.to_datetime(df['Date'], format='%Y-%m-%d %H:%M:%S')

fig, ax = plt.subplots()

df.plot('Date','Y',ax=ax,marker='x',ls='-')
ax.set_xlim(pd.datetime(1990,1,1), pd.datetime(2018,1,1))

format_xaxis(ax)

plt.show()
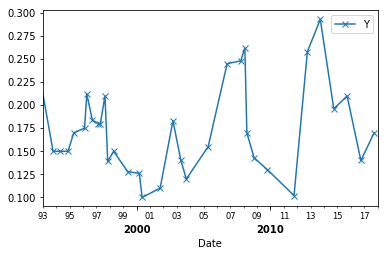
Чтобы отключить некоторые незначительные тики, вы можете изменить интервал незначительных тиков:
years1=dates.YearLocator(1)И установить видимость ложной для каждой секунды из них:
for tick in t.xaxis.get_minor_ticks()[1::2]:
    tick.set_visible(False)
После удаления второстепенных меток опция видимости в коде:
for label in t.xaxis.get_minorticklabels()[::5]:
    label.set_visible(False)
Вы увидите следующую картинку после изменения
xlimна 1993 год:
Более сложным и гибким решением является создание нового класса Formatter:# Format year minor ticks class MinorYearFormatter(dates.DateFormatter): def __init__(self, fmt): dates.DateFormatter.__init__(self, fmt) def __call__(self, x, pos): # Disable tick labels for some years if pd.Timestamp.fromordinal(int(x)).year % 2 == 0: return '' else: return dates.DateFormatter.__call__(self, x, pos)И переназначить
dfmt1на новый Форматер:dfmt1 = MinorYearFormatter('%y')
Comments